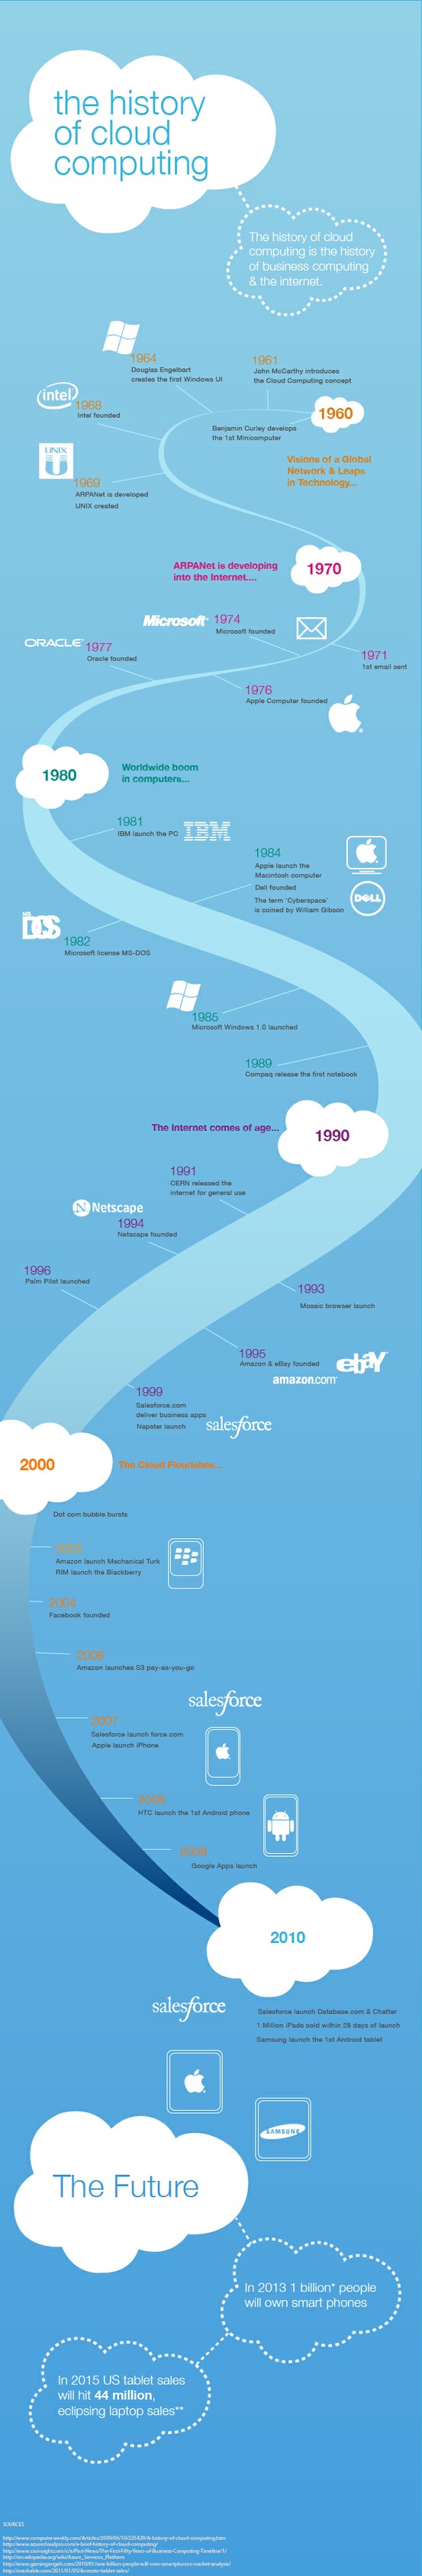
Our research continues as we are introduced to Infographics, which is a method of presenting data in a highly rich and engaging visual way. Here is one I found that directly relates to my research, since it is about the history of cloud computing (as mentioned in my previous blog post):
 |
| Image Source: http://www.infographicszone.com/wp-content/uploads/2012/11/the-history-of-cloud-computing.jpg |
In a beautiful and engaging visual timeline, we are able to follow the history of cloud computing! We can also see the icons/pictures representing the Web 2.0 technologies that are now being integrated into the classroom curriculum! This makes me very excited about Web 2.0 technologies and there are many more I am going to check out at http://www.infographicszone.com.
No comments:
Post a Comment